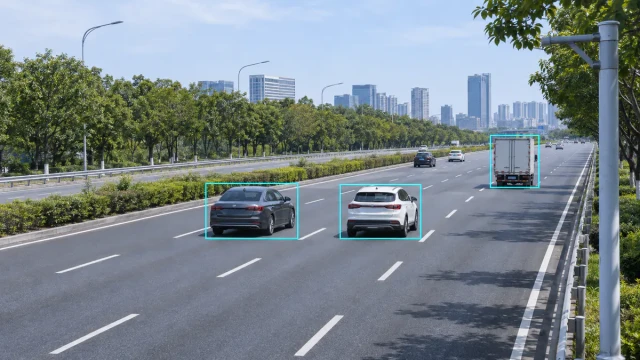
Traffic flow describes how vehicles move through a road, lane, intersection or corridor over time. It is not represented by one measurement alone. Engineers normally use a combination of traffic volume, speed, density, lane occupancy, headway, queue length and vehicle classification to understand roadway conditions.
A road can carry the same number of vehicles under very different conditions. Vehicles may be moving freely at high speed, travelling slowly in dense traffic or repeatedly stopping in a queue. Accurate traffic-flow monitoring therefore requires more than a basic vehicle count.
This guide explains the main traffic-flow parameters, how they relate to each other and how radar sensors can provide lane-level and target-level traffic data.
What Is Traffic Flow?
Traffic flow refers to the movement of vehicles through a defined road section during a specified period. Depending on the application, traffic flow may describe:
- The number of vehicles passing a point
- The rate at which vehicles arrive
- Their individual or average speed
- The distance or time between vehicles
- The amount of time a detection zone is occupied
- The concentration of vehicles along a road section
- The formation and dissipation of queues
- The distribution of vehicle types across different lanes
Traffic-flow data support road planning, congestion monitoring, signal control, incident detection, travel-time estimation and intelligent transportation systems.
Traffic Count, Volume and Flow Rate
Traffic count is the observed number of vehicles passing a detection point. Traffic volume is that count associated with a defined time interval.
For example, if a sensor detects 180 vehicles in 15 minutes, the observed 15-minute volume is 180 vehicles. If that rate continued for one hour, the equivalent hourly flow rate would be:
180 × 4 = 720 vehicles per hour
This does not mean that exactly 720 vehicles passed during the full hour. It is an hourly rate calculated from the shorter observation interval.
Traffic data should therefore always include the measurement interval. A value labelled only as “500 vehicles” is incomplete unless the period, direction and lane coverage are also defined.
Per-lane and total-direction volume
A multi-lane monitoring system may report volume separately for each lane and as a combined directional total. Keeping lane-level data is useful because congestion, turning movements and heavy-vehicle distribution may differ substantially between adjacent lanes.
AADT and short-term counts
Annual Average Daily Traffic, commonly called AADT, represents the average daily traffic volume across a full year. A short roadside count should not automatically be labelled as AADT. Converting short-term observations into annual estimates requires appropriate seasonal, day-of-week and time-of-day adjustment factors.
Vehicle Speed and Average Traffic Speed
Vehicle speed is one of the most useful traffic-flow measurements. A sensor may report the speed of every detected target and calculate statistics over a selected interval.
Common speed outputs include:
- Individual vehicle speed
- Average lane speed
- Median speed
- 85th-percentile speed
- Minimum and maximum observed speed
- Speed distribution by vehicle class
Average speed must be interpreted carefully. Different systems may use arithmetic averages of point measurements, travel speed over a road segment or other calculation methods. When data from different sensors are compared, the speed definition and aggregation method should be documented.
Traffic Density
Traffic density describes how many vehicles occupy a unit length of road at a particular time. It is commonly expressed as vehicles per kilometre per lane or vehicles per mile per lane.
The fundamental traffic-flow relationship is:
Flow = Density × Speed
Using compatible units:
- Flow is measured in vehicles per hour
- Density is measured in vehicles per kilometre
- Speed is measured in kilometres per hour
If density is 20 vehicles per kilometre and average speed is 60 kilometres per hour, the corresponding flow rate is approximately 1,200 vehicles per hour.
Density is not always measured directly by a point detector. It may be estimated from speed and flow, inferred from occupancy or calculated from tracked targets within a defined road section.
Lane Occupancy
Lane occupancy is the percentage of time that a vehicle occupies a detection zone during a measurement interval.
If a detection zone is occupied for 15 seconds during a 60-second interval, the measured occupancy is:
15 ÷ 60 × 100% = 25%
Higher occupancy generally indicates that vehicles are spending more time in the detection zone. This may result from higher traffic demand, lower speeds, longer vehicles or congestion.
Occupancy should not be confused with vehicle occupancy. Lane occupancy describes use of a detection zone. Vehicle occupancy describes the number of people inside a vehicle.
The size of the detection zone influences occupancy values. Data from sensors with different zone lengths should not be compared without understanding how each system calculates the measurement.
Headway, Gap and Vehicle Spacing
Time headway is normally measured from the front of one vehicle to the front of the following vehicle as they pass the same point. It is usually expressed in seconds.
For example, if one vehicle passes at 10:00:00 and the next passes at 10:00:02.5, the time headway is 2.5 seconds.
Gap or clearance describes the separation between the rear of the leading vehicle and the front of the following vehicle. Depending on the system, it may be reported as time or distance.
Headway data can support:
- Following-distance analysis
- Capacity studies
- Platoon detection
- Ramp and signal control
- Safety analysis
- Traffic-demand modelling
Reliable headway calculation requires accurate vehicle timestamps and correct separation of individual targets.
Queue Length and Stopped Vehicles
Queue length describes the number of vehicles or physical distance of a traffic queue. A queue may form at a signal, toll station, work zone, lane closure or congested road section.
Queue measurement can be expressed as:
- Number of queued vehicles
- Distance from the stop line to the end of the queue
- Time spent in the queue
- Queue growth and dissipation rate
A sensor must cover enough of the road to observe the expected queue. If a queue extends beyond the detection area, the system can report only the visible portion.
Stopped-vehicle performance also depends on radar type. A basic Doppler radar normally detects movement and may lose a target after it becomes stationary. FMCW and tracking radar can support range and stationary-target processing when the waveform and software are designed for that purpose.
Vehicle Classification
Vehicle classification divides traffic into groups such as passenger cars, vans, buses and trucks. Classification helps agencies understand how different vehicle types affect pavement loading, road capacity, emissions and safety.
Radar-based classification may use combinations of:
- Estimated vehicle length
- Target dimensions
- Radar cross-section characteristics
- Speed and movement pattern
- Multiple target points
Classification capability and class definitions vary by sensor. A system should not claim standard vehicle classes unless its output has been validated against the required classification scheme.
How Radar Measures Traffic Flow
A traffic radar transmits radio-frequency signals toward the road and processes reflections from vehicles. Depending on its waveform, antenna design and signal-processing software, it can measure or estimate:
- Vehicle presence
- Radial speed
- Range
- Direction of travel
- Lane position
- Target coordinates
- Vehicle trajectory
- Vehicle length or class
The system can then aggregate individual target records into lane-level traffic-flow statistics.
A typical processing chain is:
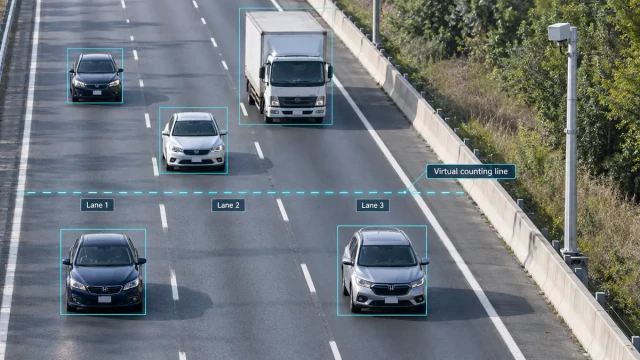
- The radar detects a target.
- The system estimates its speed, range and position.
- The target is associated with a lane.
- The target is tracked while it moves through the detection area.
- The system records its passage and timestamp.
- Individual records are aggregated into volume, speed, occupancy and headway statistics.
For more detail about radar waveforms, mounting and target outputs, see our guide to radar traffic detectors.
Forward-Looking and Side-Looking Radar
Forward-looking installation
A forward-looking radar is aimed generally along the direction of traffic. This geometry provides a strong speed component and can support long-range target tracking. Vehicles may partially block one another, so mounting height and lateral offset must be selected carefully.
Side-looking installation
A side-looking radar observes vehicles as they pass across its field of view. It can cover several lanes from the roadside and is frequently used for traffic counts and lane-level statistics.
The measured Doppler speed is influenced by the angle between the radar beam and vehicle movement. The sensor must use correct installation geometry and angle compensation to report road-aligned speed.
Traffic Flow Measurement Technologies
| Technology | Typical outputs | Important considerations |
|---|---|---|
| Inductive loop | Count, presence, occupancy and speed with suitable layouts | Requires pavement work; loop geometry affects measurement |
| Radar | Speed, count, range, lane, trajectory and flow statistics | Requires correct mounting, lane mapping and occlusion analysis |
| Video detection | Count, speed, classification, queue and turning movements | Lighting, weather, camera movement and occlusion can affect results |
| Magnetic sensor | Presence and count; some systems estimate speed | Usually provides localized detection and may require pavement installation |
| LiDAR | Position, speed, dimensions, trajectory and classification | Cost, field of view, lens condition and difficult weather require evaluation |
Aggregation Intervals
Traffic data may be aggregated over intervals such as 20 seconds, 30 seconds, one minute, five minutes, 15 minutes or one hour.
Short intervals show rapid changes and are useful for incident detection and real-time control. Longer intervals produce more stable values and are useful for planning and reporting.
The appropriate interval depends on the application:
- Real-time incident monitoring: short intervals
- Signal and ramp control: short or event-based updates
- Congestion performance monitoring: one- to five-minute intervals
- Planning counts: 15-minute, hourly or daily summaries
- Long-term trends: daily, monthly and annual summaries
Systems should retain individual target data when possible if different aggregation intervals may be required later.
Traffic Flow Data Quality
Traffic-flow statistics are only as reliable as the underlying detections. Common sources of error include:
- Missed vehicles
- One vehicle counted more than once
- Incorrect lane association
- Occlusion between vehicles
- Detection of vehicles on adjacent roads
- Incorrect mounting angle
- Clock or timestamp errors
- Lane changes inside the measurement zone
- Queues extending beyond sensor coverage
- Changes to road layout without updating detection zones
Validation should compare sensor results with a trusted reference over representative traffic conditions. Tests should include low and high volumes, different lanes, congestion, heavy vehicles and lane-changing traffic.
Raw Target Data and Aggregated Statistics
Aggregated data are convenient for traffic-management platforms because they reduce communication and storage requirements. However, aggregated results do not always explain why a value changed.
Raw or target-level data may include:
- Target identifier
- Timestamp
- Speed
- Range
- Lateral position
- Lane
- Direction
- Trajectory points
- Estimated vehicle class
Target-level data allow the receiving system to calculate its own intervals, apply project-specific lane logic, analyze trajectories and verify aggregated statistics.
Applications of Traffic Flow Data
Accurate traffic-flow information supports:
- Congestion monitoring
- Travel-time estimation
- Adaptive traffic control
- Ramp metering
- Incident detection
- Queue warnings
- Variable-message signs
- Road-capacity studies
- Before-and-after project evaluation
- Traffic-demand modelling
- Road maintenance and planning
The required sensor output depends on the application. A planning count may require only volume and classification. A real-time incident system may need frequent speed, occupancy and target-position updates.
Multi-Lane Radar for Traffic Flow Monitoring
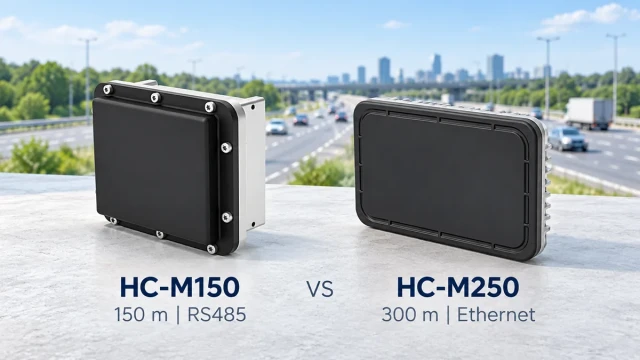
The WaveLogic HC-M150 multi-lane traffic radar provides target speed, position and trajectory information for system integration. Its target-level output can support lane association, individual vehicle records and traffic-flow statistics calculated by an edge controller or traffic-management platform.
Project design should define:
- Number and width of monitored lanes
- Required detection distance
- Mounting position and height
- Traffic direction
- Required update rate
- Target-level or aggregated output
- Communication protocol
- Required traffic-flow indicators
For a system-level overview, see the traffic flow monitoring radar solution.
Frequently Asked Questions
What is the difference between traffic flow and traffic volume?
Traffic volume is the number of vehicles observed during a defined interval. Traffic flow is a broader description that can include volume, speed, density, occupancy, headway, queues and vehicle composition.
What is lane occupancy?
Lane occupancy is the percentage of time that vehicles occupy a sensor’s detection zone. It is commonly used as an indicator of traffic conditions and congestion.
Can radar count vehicles in multiple lanes?
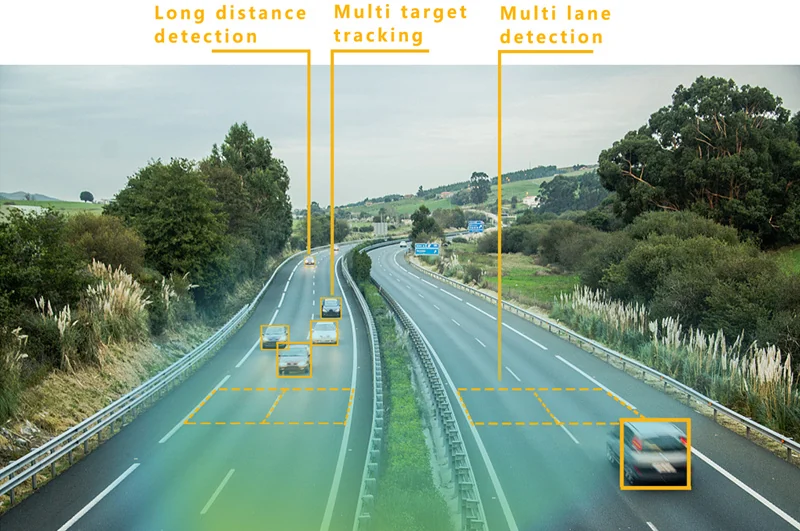
Yes, a radar designed for multi-lane operation can detect targets across several lanes. Accuracy depends on field of view, mounting position, lane mapping, road geometry and target occlusion.
Can radar measure traffic density directly?
A point radar often derives density from flow, speed or occupancy. A tracking radar covering a defined road section may also estimate density from the number and position of active targets inside that section.
What data interval should be used?
Short intervals are useful for real-time operations and incident detection. Longer intervals are more suitable for planning and trend reporting. The interval should match the intended application.
Is a short-term traffic count the same as AADT?
No. AADT represents average daily traffic over a full year. Short-term counts require appropriate adjustment factors before they can be used to estimate AADT.
Conclusion
Traffic flow cannot be described by vehicle count alone. Volume, speed, density, occupancy, headway, queue length and vehicle classification provide different views of road performance.
Radar can supply both individual target records and aggregated lane-level statistics without cutting the pavement. Reliable results still depend on correct mounting, lane mapping, aggregation rules and field validation. The sensor and data format should therefore be selected according to the decisions the traffic-management system needs to make.